http://www.ats.ucla.edu/stat/mult_pkg/perspective/v18n2p15.htm
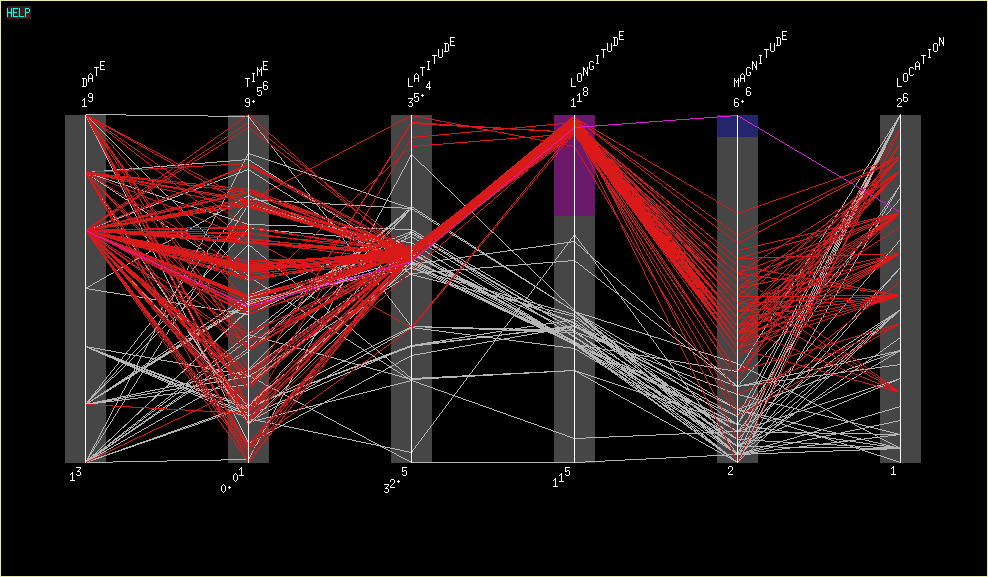
A parallel coordinate graph is a tool to visualize and analyze multivariate data. There are vertical lines as a backdrop to measure the lines of data. This parallel coordinate graph illustrates an earthquake.
No comments:
Post a Comment